

- July 8, 2025
We hear a lot of questions about inflation lately. It’s understandable. It’s nearly impossible to avoid seeing or hearing mention of it in financial, business, or even popular media these days. Unfortunately, it’s usually presented in a manner to elicit maximum concern, followed by a call to take some action. Often, the prediction for more inflation or the call to action is presented by an “inflation expert.” This is a title given to one who likely has been predicting inflation for the last 20 years and is motivated by his or her moment in the sun (after being wrong for 20 years) rather than our best investment interest.
I can’t dispute the numbers. The latest inflation data is higher than most of us are used to seeing, and anyone who has recently tried to buy a 2x4 can attest to this anecdotally. The inflation reading for May, as reported by the Wall Street Journal, showed that headline CPI rose 5% from May 2020 and 0.8% from April 2021. This equates to an annualized rate of 10%. But wait, didn’t we have a rather significant economic event a year or so ago that actually caused prices to temporarily fall? Reading deeper into this article we do find that prices have only risen an annualized 2.5% from May 2019. This seems far less concerning.
Again, context and nuance matter more than a headline number. Nonetheless, it does seem as if we may be witnessing some economic forces many of us haven’t seen for a while. This only increases the importance of asking the right questions to arrive at a useful answer.
What’s actually in the inflation data?
The data is messy to say the least. Prices for used cars and trucks were up 7.3% but college tuition was up only 0.3%. Rental car rates were up 109% but drug prices were down 1.7%. Lumber was up 202% (!) but recreation was up 0.6%. All the high-priced home sales and rental rates we’ve been hearing about? Shelter was only up 2.1%. Energy was up 51%, but remember, oil prices went negative in April 2020 and were still crawling out of a low level in May.
Let’s draw a parallel example: short-term stock returns. The S&P 500 posted a total return of 51% from May to May. I don’t think anyone expects the next 12 months to look like that, but we also painfully remember the 35% drop that led to this recovery and new wave of growth. What we didn’t see as clearly - prices of goods and services across the economy fell an annualized 2.5% in March 2020, another 7.75% in April and were flat in May of 2020. Similar to oil prices and stock prices, economy-wide prices had a decline to recover from. Economists call this the base effect – when starting from a low base, next-period comparisons will be skewed in the inverse direction from where they started.
We can correct for base effect by using lagged data. As mentioned above, if we just go back another year, we see that the 2-year average inflation is running only slightly above the Fed’s target of 2%, coming in at about 2.5%. Over the last three years, the average annual rate is running at 2.2%. For Fed watchers in tune with the Central Bank’s 2% inflation target, they are targeting a long-run average rate of 2%. Prior to May’s reading, the average annual and average rolling 2-year annualized inflation numbers have been less than 2% for the last ten years, which is why the Central Bank may seem ok with a bout of above trend inflation.
None of this is to suggest that we should outright dismiss the more recent data, but like so much in markets and economics, the shorter time horizon in which we evaluate data the more noise can enter the picture. Upon review of inflation data going back to 1915, the average inflation for month-over-month, 1-year, 2-year, and 3-year annualized period range from 3.1% to 3.4%. In looking at the standard deviations of readings in those periods, the 1-year, 2-year and 3-year annualized numbers range from 3.9% to 4.9%. This is a pretty tight range. However, the standard deviation for the month-over-month reading? 8.4%! Or nearly double the volatility of the data. So, is what we’re recently experiencing signal or noise?
Will inflation continue to rise?
Here is an answer that is guaranteed not to get me on CNBC. I don’t know. I am perfectly happy with and, I believe, professionally honest in providing that answer. I also firmly believe that any prediction stating a specific outcome is either wrong or lucky. But, while I may not put much stock in predictions, I do have faith that markets can reasonably price assets and assess risk. Again, in the short-term it is a messy process, but over time market forces tend to smooth out the noise.
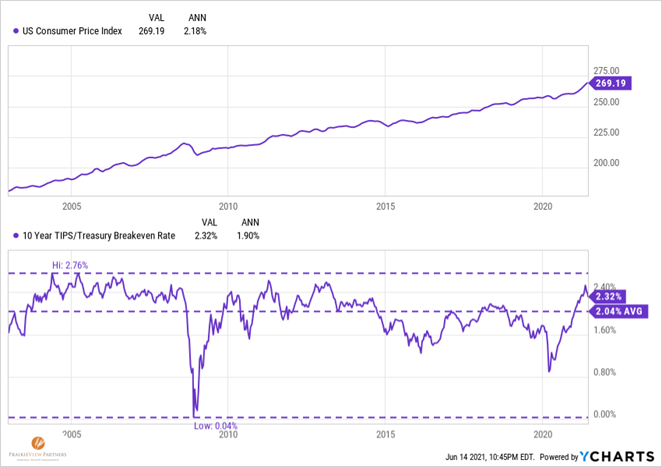
The charts below show (top) the growth in the Consumer Price Index over the last 10 years and (bottom) the market-based expectation of inflation over the prospective 10-year period. We can see that the real-time expectations are much more volatile at a given time than the actual result in the economy over time. The average market-based expectation of the last 10 years has been 2.04% and the actual growth in the CPI has been 2.18%.
The far right of the lower chart illustrates the rapid decline and bounce back we’re seeing in recent numbers. However, if you look closely, the far right of the bottom chart actually shows that the 10-year inflation expectations have retreated a bit from their peak in April. This would indicate that inflation over the next 10 years might be in the mid-2% range. This doesn’t rule out short-term above-trend readings and, while higher than the recent past, does not seem to be a troubling indicator.
In Fed speak, the term “transitory” has frequently been used to describe their outlook for short-term above-trend inflation as prices reset from supply and demand imbalances created by economic shutdowns are resolved. Three examples offer different ways to evaluate this:
Lumber: After rising 202% in the May-to-May period, futures contracts for July delivery are already down 42% from May’s prices. To a lesser degree, this may be a model for other categories where supply can ramp up in a reasonable time or consumers can change behavior temporarily to let supply catch up.
Used Car and Rental Car prices: New car manufacturers are struggling to produce inventory due to chip shortages caused by pandemic shutdowns AND multiple fire and other natural disaster events that disrupted global chip supplies. Low new car supply has put pressure on the used car market. Rental fleets sold off their fleets in 2020 as a means of survival and are now slowly rebuilding. These are likely categories that will sort out their imbalances but it might take a little while longer.
Wages: This is a category that is less likely to be transitory as once they start to rise, employers are loathe to reduce wages. It’s also a category that in many cases has lagged overall inflation in recent years and also hasn’t seen the recent headline grabbing increases of other categories. All things considered, and provided other pricing categories prove transitory, higher real wages could be a net positive to economic growth. One last thing to consider here is that employment growth at the lower end of the wage spectrum has been the slowest and could skew wage inflation lower if it accelerates.
We still have the issue of the historic amounts of liquidity injected into the economy through fiscal stimulus, which is often cited as a cause for inflationary pressures. But as was written about here, a higher money supply is only half of the equation. That money needs to also change hands (velocity of money) at the same or increasing rate. The evidence still points to low and declining velocity of money even as the economic recovery accelerates.
You may hold more cash than you have in the past and you’re not alone. Most consumer surveys indicate higher than average checking and savings accounts and in the last quarter money market funds received more deposits than any other fund type by a large margin. This ultimately means that consumers and savers are in better financial health, but with that cash sitting in checking, savings, and money market accounts and changing hands less frequently, inflationary forces of “more cash in the system” can be held in check.
As we experience short-term bouts of higher-than-trend or higher-than-expected inflation, long-term structural deflationary forces are the dominant forces in our economy. Production inputs rely more on technology and knowledge than factories and natural resources, globalization continues to allow production to migrate toward lower cost geographies, and businesses and consumers are equipped with better information to make choices and trade-offs.
What does it mean for my portfolio?
An economic environment we haven’t recently seen can lead to an understandable desire to take action or question if one’s investment position remains sound. I would counter that it is precisely the time to avoid taking action. Consider:
- The potential for higher inflation has been well communicated for months meaning it is already factored into market prices of investable assets.
- Investment categories commonly thought to provide a “hedge against inflation,” i.e. commodities and related investments, have under-performed stocks over long investment periods, have generally only prospered in short time frames, AND have generated negative real (after-inflation) returns over long time horizons (since 1999, since 1980, since 1971 and more than half of all decades in between).
- Adjusting an investment portfolio in response to any speculative outcome is effectively market timing and we know that tends to have a spotty track record at best.
While not perfect all the time, the long-term above-inflation returns of a diversified stock portfolio is hard to dispute. Might stock returns be lower in the next ten years than the last ten years? Given the returns of the last ten years, I would be more surprised if that is repeated than if returns were lower than the last ten years.
But in the ultra-low to nearly non-existent inflationary environment of the last ten years, growth stocks flourished and value stocks lagged. The opposite outcome is highly possible in a higher inflation environment and a well-diversified portfolio contains both. If inflation causes the value of the dollar to fall relative to other global currencies, that would be beneficial for stocks of international companies – another core component of a well-diversified portfolio.
Might bond returns be weaker if, and when, interest rates rise? Yes. But the bonds we owned in the first half of 2020 provided a priceless service to our portfolios – when stock prices were down 35% over five weeks, bond returns were positive. If they experience lower returns in the short-term as interest rates rise, that means the yields we can earn from them, and their total return, on a prospective basis are higher than they are today. This is a positive outcome for long-term investors.
The point of all of this is not to dismiss the real possibility of higher inflation than we’ve become accustomed to in the coming months. Rather it is to highlight that a well-diversified portfolio constructed of a stock and bond mix that represents your risk and needs is likely to remain the best method to provide long-term above-inflation returns. This has held true throughout multiple different inflationary environments in the past.
This is also not to suggest that it will all be smooth sailing as markets digest fluctuations in inflation readings and changing Fed policy. But it’s important to remember that the economy is not the stock (or bond) market and the stock (or bond) market is not your financial plan. And a successful plan-driven, long-term investor doesn’t speculate or trade on potential short-term events.
If pressed, and consider this an opinion rather than a prediction, I am in the camp of above-trend and somewhat volatile inflation readings over the near-term while the post-COVID economy sorts itself out, which then settles into a modestly higher rate than the low rates of the recent past. But, it’s likely that outlook may prove wrong or lucky. I’m not one to make an investment decision based on a likelihood of being wrong or a need to be lucky. So, that leaves us with an investment strategy that has been successful through multiple inflationary environments.
Thanks for reading.
Sources: WSJ, Bloomberg, YCharts, San Francisco Fed, Deutsche Bank Long Term Asset Return Study.