

- July 8, 2025
How’s the Market Doing? It Depends.
A simple and innocent question greeted with the most unsatisfying and noncommittal answer possible. Sorry. But it’s true. It depends on the market in question – stocks, bonds, or any other market you can think of. It depends on the time frame – last quarter, last year, the last several years, next year (always the hardest one to know). And it can depend on your expectations. It can even depend on your investment time horizon.
Let’s take some time to look at how a few markets are doing or have done based on different time frames for buyers and sellers, and, importantly, relative to expectations.
Stocks
The market in question is usually stocks but can often be a proxy for all financial markets or even underlying economic conditions. Let’s start with stocks. In the last quarter, the S&P 500 was down 3.3% - that doesn’t sound too great. Over the last year it is up 21.6% - that sounds pretty good.
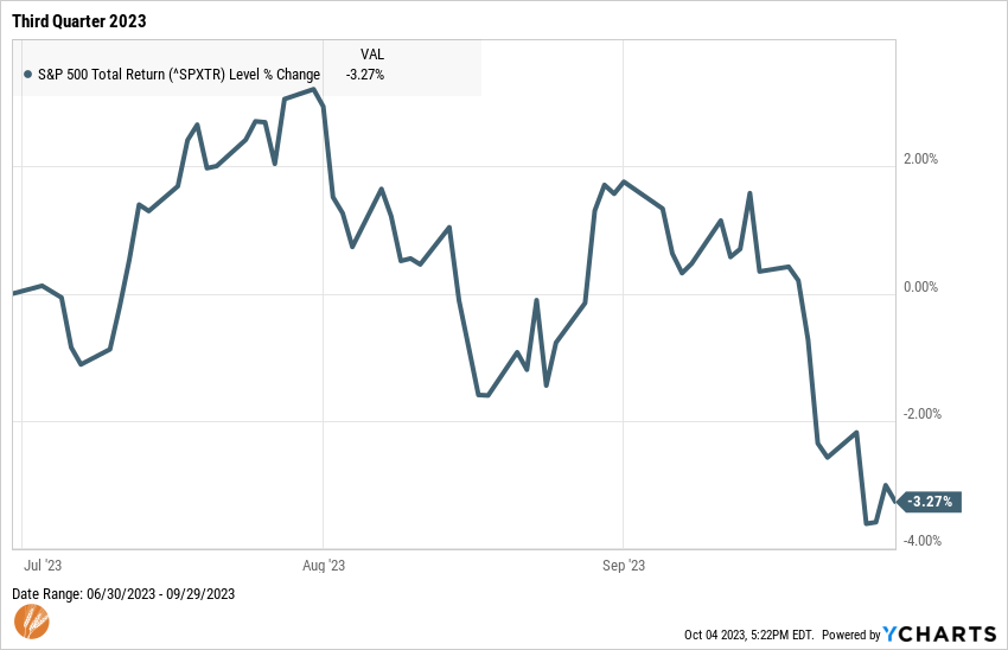
Figure 1: After a quick start to the year in the first six months, stocks pulled back during the third quarter.
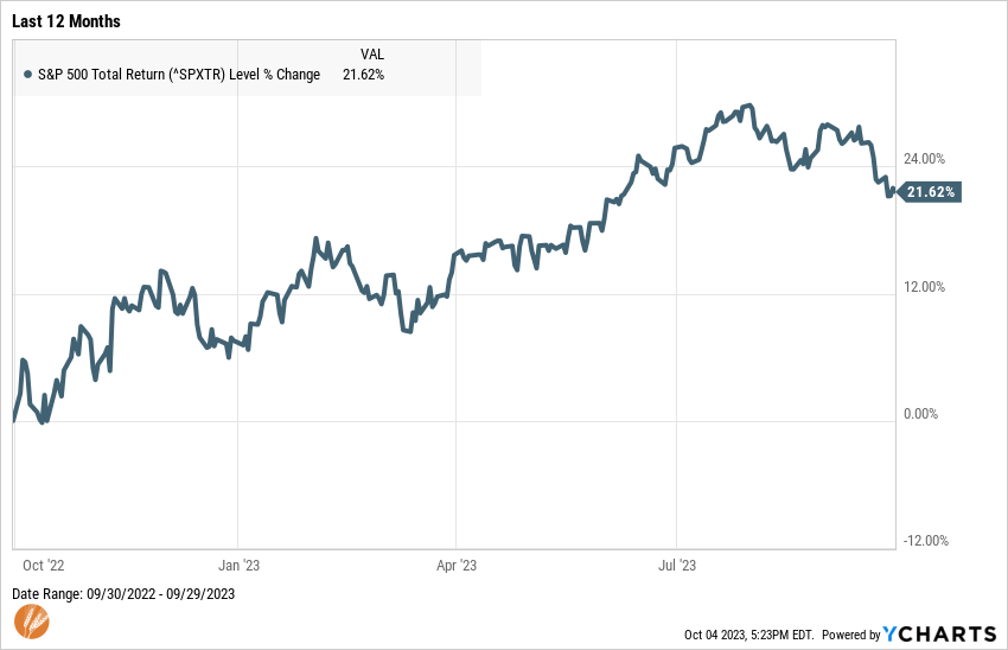
Figure 2: The low point for stocks, and near the peak of pessimism, of the current bear market cycle was 10/13/2022. While not yet back to the previous peak, the recovery has been welcomed and should provide evidence of the importance of remaining invested.
Both are quite short time periods and lack meaning without context. The returns from a year ago reflect a starting point near bear market lows when stocks bottomed 25% off their previous all-time peak. The return of the past quarter likely reflects the fact that the S&P 500 experienced one of its best first six months of any year and was due for a break. And yet, it’s still up 13% since the start of the year.
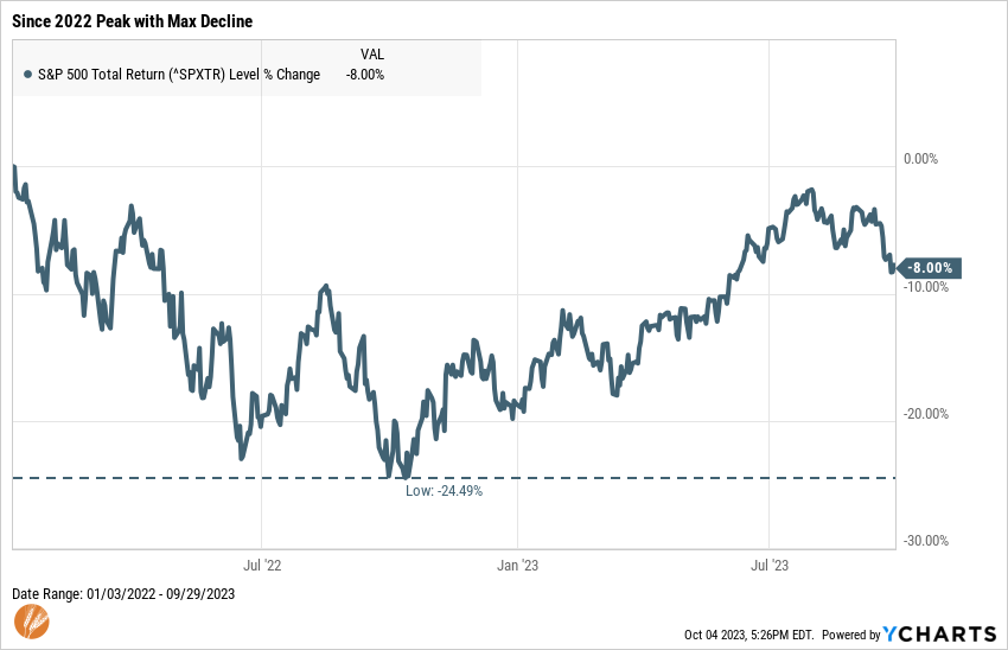
Figure 3: 21 months of stocks being off their highs seems like a long time but is still quite short for long-term investors
If we zoom out a bit, the S&P 500 posted annual returns of 10.1%, 9.9%, and 11.9% over the last three, five, and ten years, respectively. Again, context is important. The average annual return since the beginning of the index in 1926 is 10.1%. This shows that, as expected, longer measurement periods bring us closer to the long-term average and a reasonable expectation for stocks. Even with stocks still about 8% off their all-time high, annual returns over the last several years are in line with long-term averages.
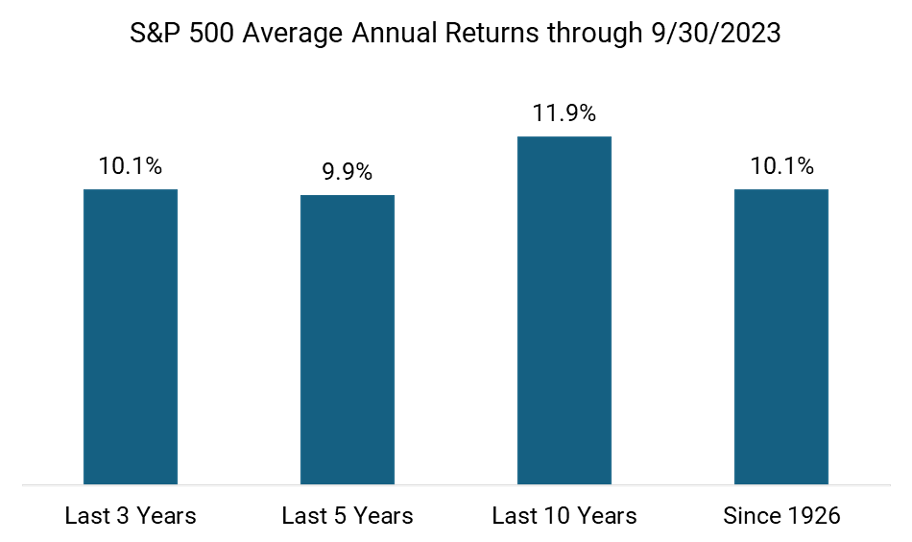
Figure 4: The longer we evaluate stock returns, the more we can expect them to emulate their long-term expectations. Source: DFA Returns Web.
The 3.3% decline of last quarter wasn’t even the biggest decline of the year so far. That award goes to the decline in March precipitated by the SVB and other bank related worries, which sent the index down 8%. When the average intra-year decline has been about 14%, a 3% or 8% decline doesn’t sound too bad or out of the ordinary.
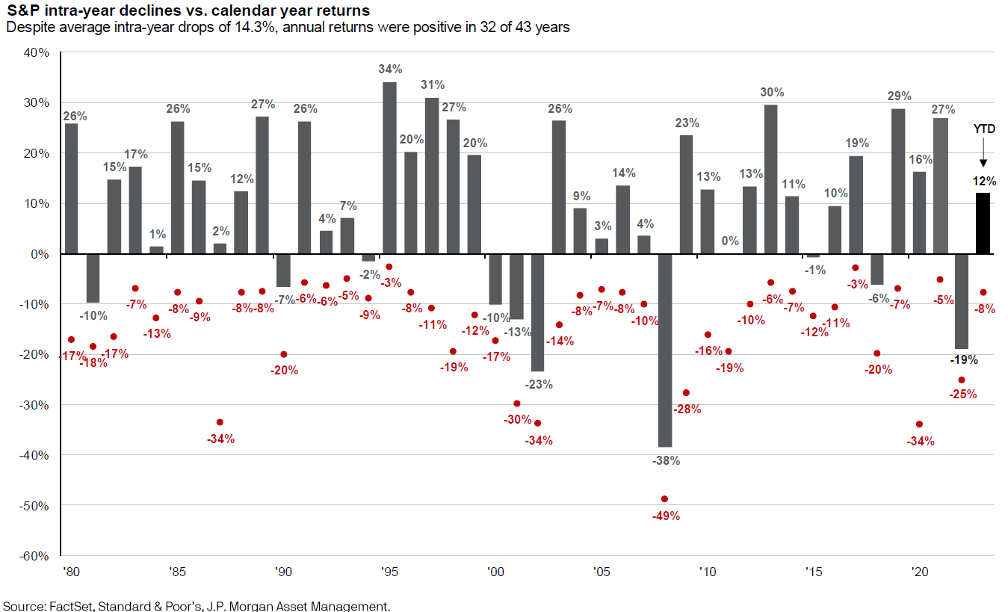
Figure 5: Periodic, frequent, temporary declines should be a fundamental expectation for long-term investors
So, how’s the stock market doing? All things considered, stocks, at least as represented by the S&P 500, seem to be doing as expected – returns over a quarter or year are fluctuating more than those of three, five or ten years, which have all closely approximated the long-term average. While it can be understandably disappointing that stocks have been below their previous peak for 21 months now, declines like this are well within reasonable expectations and returns over longer time frames are close to averages despite being at lower levels.
The crystal ball for where they go from here is cloudy, as always. Valuations are quite close to their long-term average, indicating that stocks aren’t necessarily under or overvalued at this point. As we’ve seen, stock prices can vary from average valuations in the in the short-term. But based on recoveries from past declines, history is on our side.
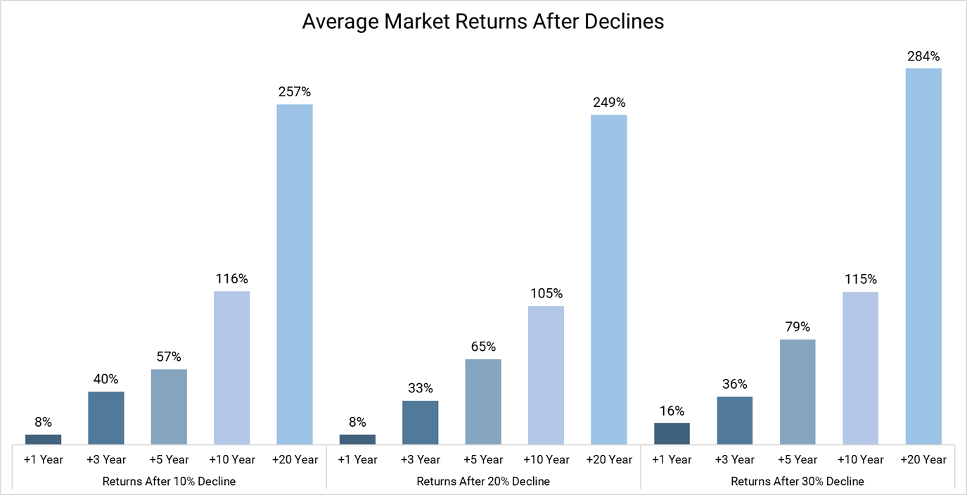
Figure 6: The eighth wonder of the world - compound returns
Perhaps the only group that might want to prepare to be disappointed are the investors surveyed by Natixis Investment Management earlier this year who responded with average expected annual returns of 15.6% above inflation from stocks over the next decade.
Interest Rates and Bonds
One of the biggest stories in financial markets of the last 18 months has been interest rates. Understandably so, as they have been driven higher at a historic pace by efforts from the Federal reserve. After years of being at or near zero, the Federal Funds rate – the only rate directly set by the Federal Reserve – has risen to 5.5%, which is the highest it’s been since January 2001. It’s also the fastest and highest the Fed has increased rates in any previous rate increase cycle.
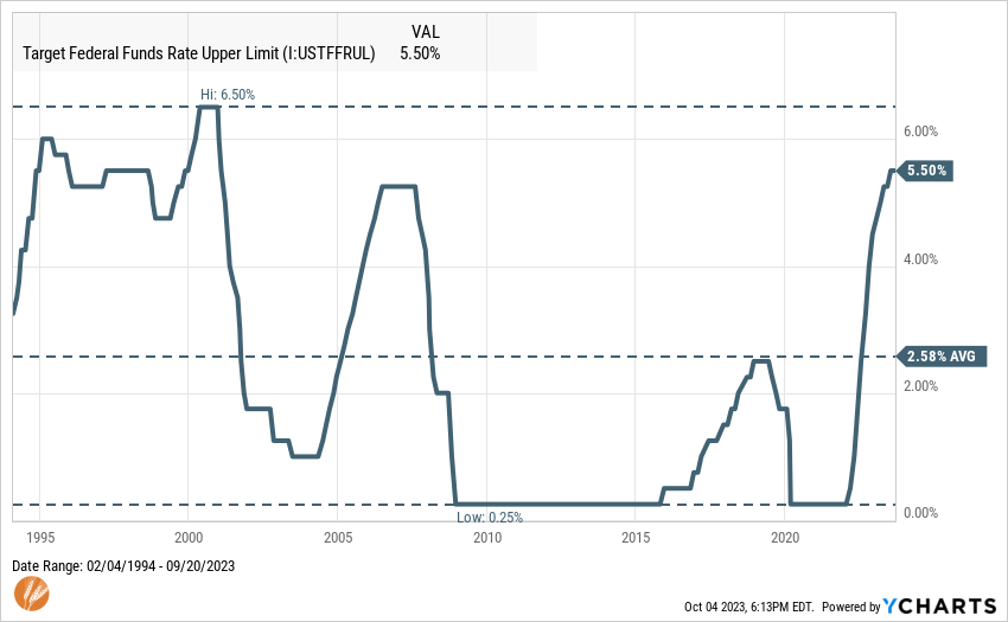
Figure 7: The Fed Funds Rate is now at its highest level since 2001.
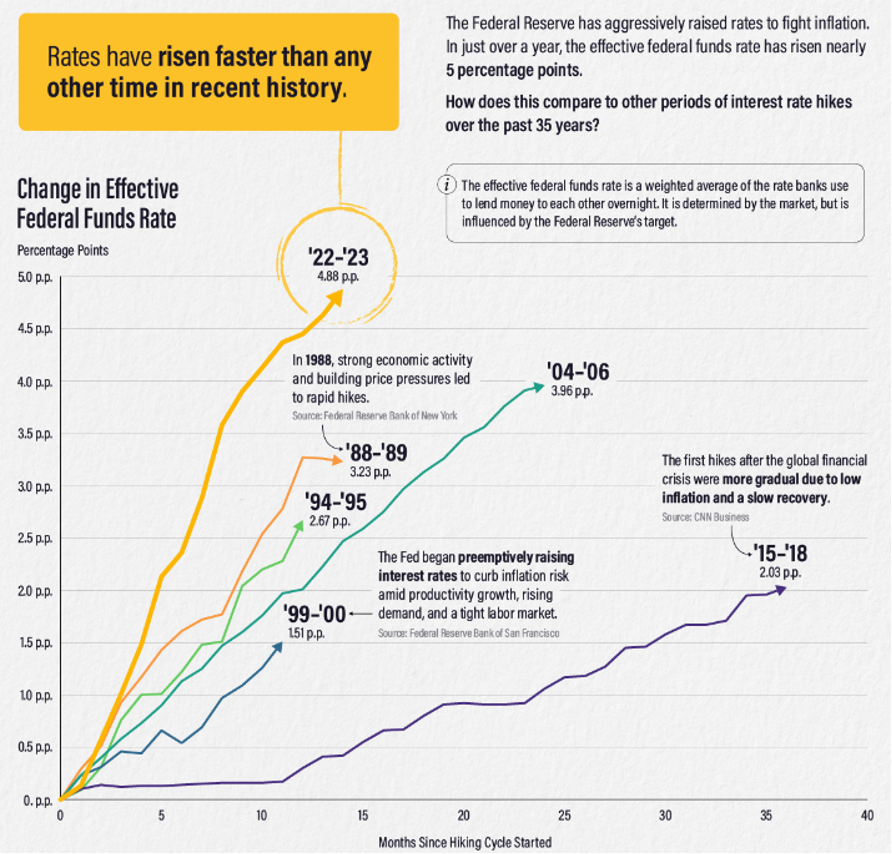
Figure 8: The path the Fed has taken to get to the highest Fed Funds rate since 2001 has been the most significant increase in their benchmark rate in 35 years.
The rate increases originated in response to rising inflation, which peaked in mid-2022, and have continued as inflation has fallen considerably and consistently throughout 2023. We can now earn approximately 4.5% on our online savings accounts, 5% on short-term Treasury bills and nearly 5% on a diversified portfolio of bonds. It certainly hasn’t been smooth sailing to get to this point, though.
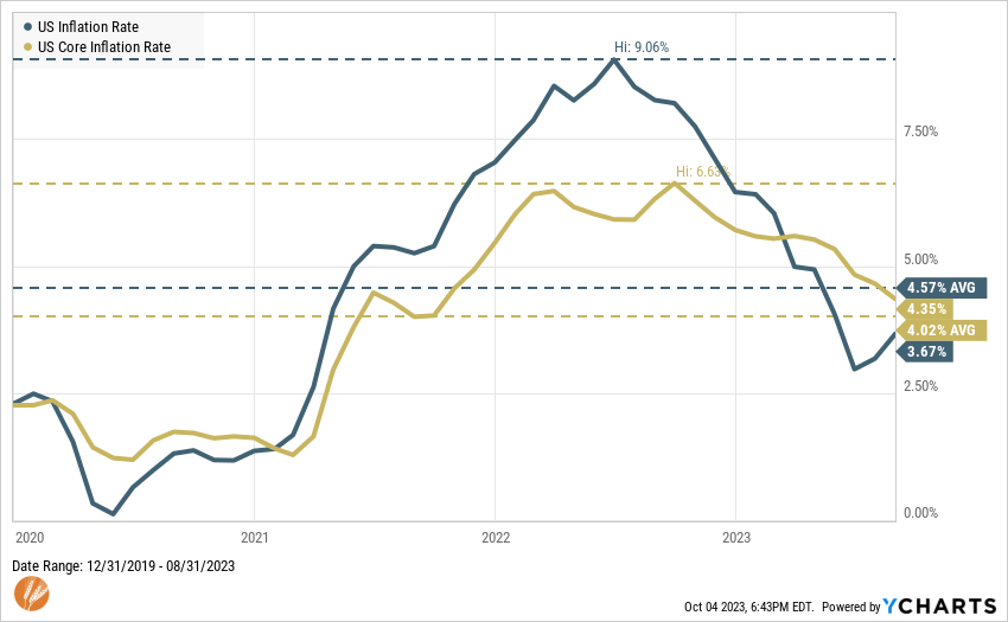
Figure 9: The rapid rise in interest rates has put the brakes on inflation, but the decline has slowed, and it remains above the Fed's preferred 2% level.
A fundamental core feature of bonds is that when interest rates rise, the prices of outstanding bonds decline. The opposite is also true – when interest rates fall, prices of outstanding bonds rise.
The latter is what investors had become accustomed to for most of the last 40 years. Even though interest rates were low and getting lower, the price increases of recent decades offset low interest payments to produce attractive total returns. After 40 years of a similar trend, investors started to expect a certain outcome from bonds. In many cases this led to the riskiest bond investments – long “duration” or low-quality bonds – having an outsized position in many investors’ portfolios. These types of investments often work until they don’t, and of course everyone participating in this risky trade is shocked when the music stops – there are many parallels to this in other markets best left for a separate writing.
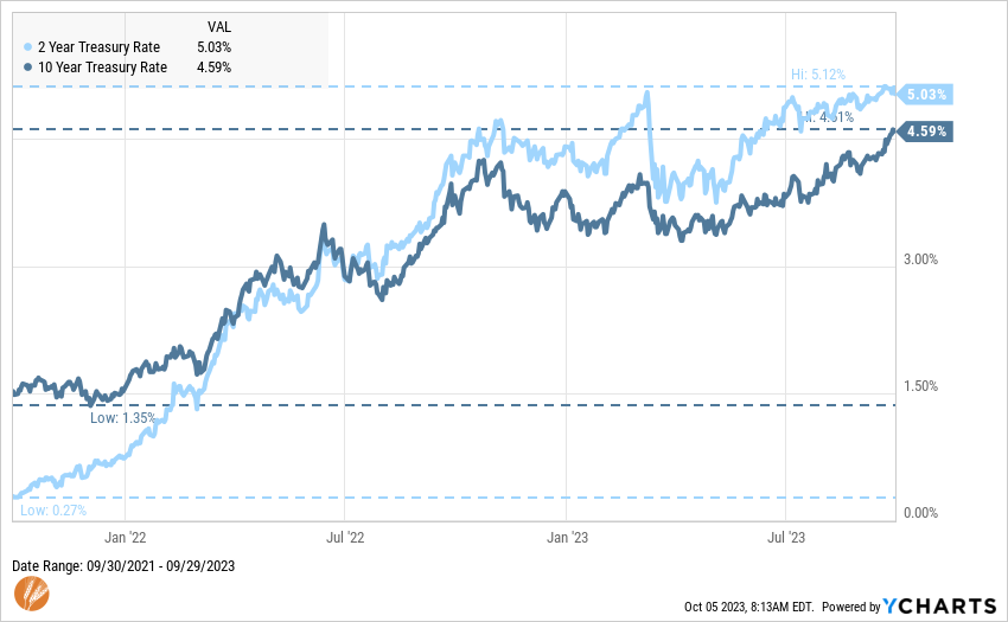
Figure 10: Treasury rates have risen from historic lows to the highest levels seen in over 20 years in less than 2 years
The path from near-zero interest rates to where we are today has resulted in the most significant bond bear markets in history. This amounts to a 17% decline in the Bloomberg Aggregate bond index (figure 11 below) – certainly not in the realm of stock bear markets that have ranged from declines of 20% to 50%. But we don’t expect 17% declines from bonds, particularly in a year (2022) when stocks also fell.
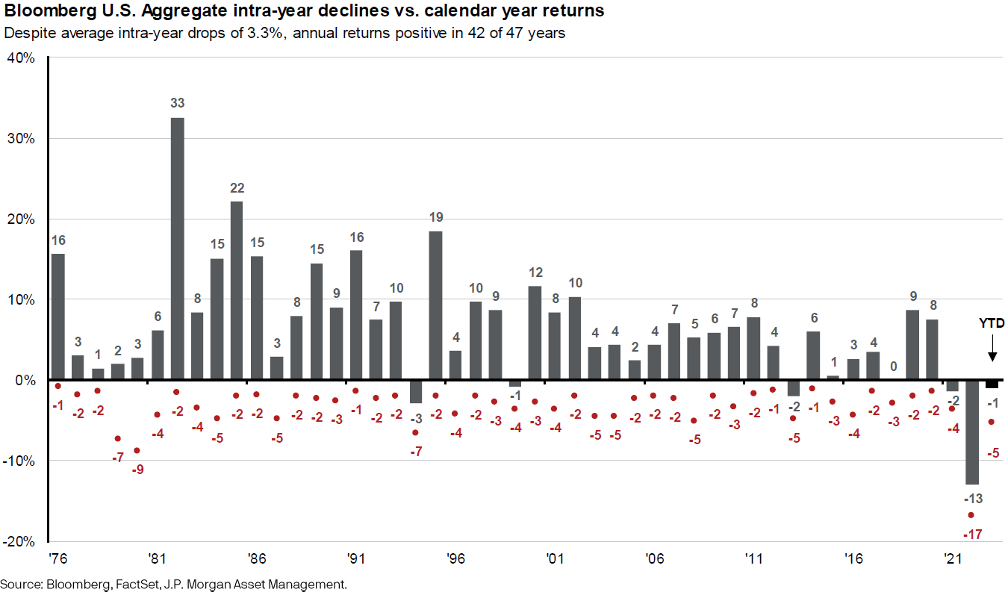
Figure 11: Like stocks, bonds also experience regular declines but to a much lesser degree. The 17% decline in 2022 was an outlier driven by the rapid interest rate increase. Short-term bonds' decline was about half the amount of this index.
Like stocks, there is more “under the hood” of a particular index, in this case the bond index. Long-term Treasury bonds have declined nearly 40% whereas short-term Treasury bonds experienced declines in the mid-single digits. The feature of bonds mentioned earlier, where the price falls when interest rates rise, is more pronounced the longer term the bond.
Investing in long-term bonds with the expectation that rates would remain low into the future would have left one with a large decline to recover from in their bond portfolio. However, investing in short-term bonds with the expectation that interest rates can, and usually do, rise after falling for many years led to a far lower decline in a bond portfolio, which better balanced stocks’ 2022 decline.
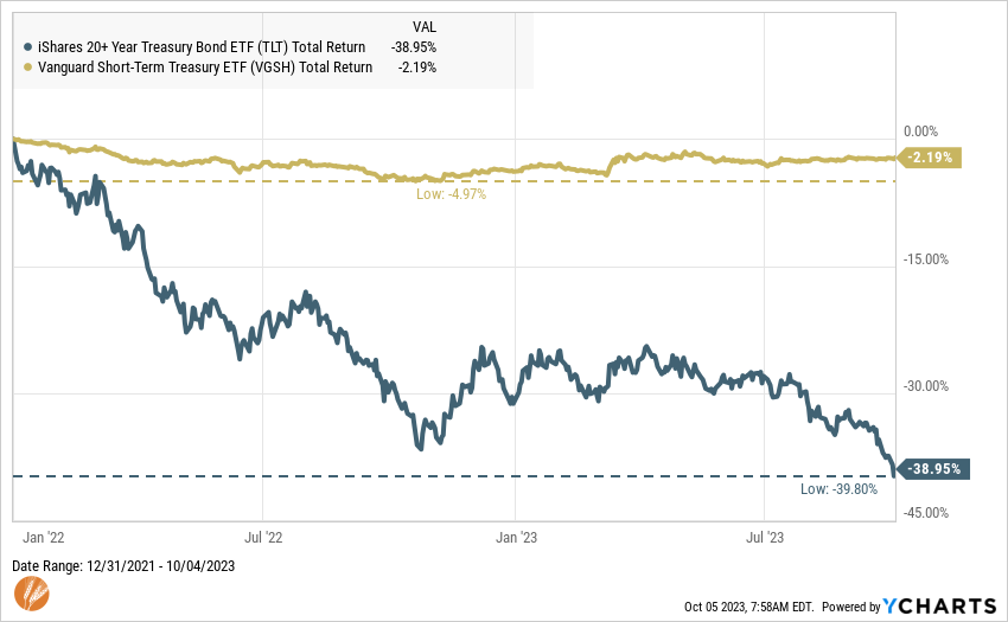
Figure 12: Not all bonds, even Treasury bonds, are the same. Interest rate changes impact prices of long-term bonds more than the prices of short-term bonds. This relationship paid off for investors for many years, but changed once rates began to rise.
Since the biggest determinant of future bond returns are starting rates, the prospects for future returns from bonds are better than in quite some time, which will also benefit a balanced portfolio. Consider a portfolio of 60% stocks and 40% bonds starting with 5% interest rates compared to 1% as recently as two years ago. If we expect to earn a long-term return of 6% on a 60/40 portfolio and start with interest rates of 1%, we need to earn 11% from the 60% in stocks. If we start with 5% interest rates, we only need to earn 7% on the 60% in stocks.
So, how’s the bond market doing? This is where I’ll recall a line from the economist David Kelly that I heard him say nearly 20 years ago when asked this question. He said the market is never doing anything – the actual questions being asked are how has the market done or how is the market going to do? This distinction is quite striking for bonds at this point.
Reflecting on how the bond market has recently done certainly shows that the path to higher rates has caused unusual volatility and higher than expected declines in many segments of the bond market. Those who overextended their risk* in search of higher interest yields in past years, thinking that all bonds are “safe” or higher interest rates were a thing of the past, were likely disappointed.
For investors now earning higher interest rates and who own mostly short-term bonds in a balanced portfolio for the long-term, the market is better positioned to provide future returns from the bond side than it’s been in many years.
The common theme among these two markets is that depending on your expectations or time frame, markets can be viewed as doing well or not so well. The important things to consider for long-term investors are:
- Plan to experience different market conditions
- Set expectations and evaluate results relative to reasonable time horizons
- Build portfolios to reflect those expectations and time horizons.
All of this is to say that regardless of how the market is doing at any point in time, long-term goal-focused investors will be rewarded for the amount of investment risk that aligns with their financial plan.
*Regardless the asset class, economic environment, predictions that “this time is different” **, etc., overextending one’s risk is more often a matter of when and not if, it will prove costly. Even for bonds.
**The famously successful 20th century investor, Sir John Templeton, once said that the four most dangerous words in investing are “this time is different.”