


- July 8, 2025
Welcome to the halfway point of 2019! If you’re anything like me you might be wondering how the last six months seemed to fly by so quickly. It seems like only last week when we were watching New Year’s fireworks and now it’s already time for 4th of July fireworks. Maybe your next thought goes one of two ways, either “Wow, the first half flew by, I can’t wait to see what the next half has to offer!”, or “Wow, those last six months flew by and I now I only have six months left, how am I going to get to this, that and the other?”.
I hope that everyone has had an enjoyable first half of 2019 and is looking forward to the next six months, but I use that example to highlight how small differences in the interpretation of a single fact can shape our outlook and actions. In this case, the fact is that 2019 has reached its chronological midpoint, but our interpretation of that fact can shape our mindset for the coming six months and then possibly our actions, plans or decisions.
Investment Facts: Open to interpretation
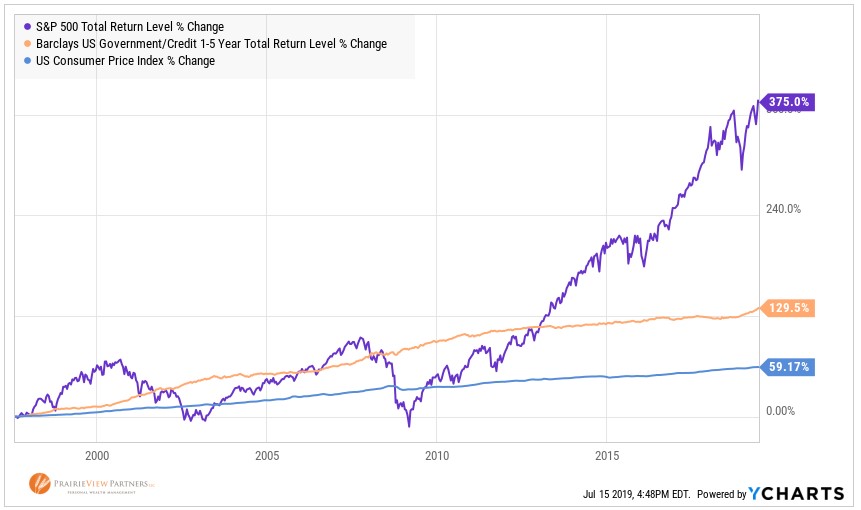
This chain of events happens every day in the investing world. Take a recent headline superlative from the Wall Street Journal highlighting the performance of stocks through the midpoint of the year: “S&P 500 Posts Best First Half in 22 Years”. For anyone doing the math at home, 22 years ago was 1997 just prior to the tech bubble reaching its highs. This proclamation may elicit a couple different reactions. One could be “Oh no, we know how that story ended in 2000”, whereas another could be “Great, we’re going to be partying like its 1999!”
Again, we see one fact, but our interpretation of that fact can shape how we view our current investments and possibly how we make new investment decisions. Is one interpretation right and the other wrong? Well, both of them only consider relatively short investment time horizons and 22 years later, the S&P 500 has returned nearly 400% including dividends – three times the return of short-term bonds and six times inflation. Given that 22 years is a time horizon more in line with most investors’ goals, neither interpretation should influence our investment decisions over a short time horizon.
Ah, but what about those two unpleasant times for stocks during the last 22 years called the Tech Crash and the Great Financial Crisis? Surely, those times mattered! Yes, they certainly did matter. They mattered in the sense of reinforcing the importance of identification of financial goals, planning for those goals, and having an investment plan and portfolio that reflects those goals to allow us to benefit from the benefit from the last 22 years of growth rather than focusing on short-term events and headlines.
High or low oil prices aren’t always black or white
Another often seen headline highlights oil prices reaching a low or a high price and implies that this must matter to investors. Most recently, this category of headline has focused on oil prices having reached a bear market low (a decline of 20% from a recent peak). One interpretation of this fact is as a sign of impending doom for economic growth. Another interpretation of this single fact is that, because high oil prices effectively translate into a tax on consumers, low oil prices could help to stimulate growth.
The next time we see headlines about exceptionally high oil prices we may see interpretations highlighting the signaling of strong economic growth (positive interpretation) or the prospects of higher inflation rippling through the economy, causing the Federal Reserve to raise interest rates and thus causing economic growth to stall (negative interpretation).
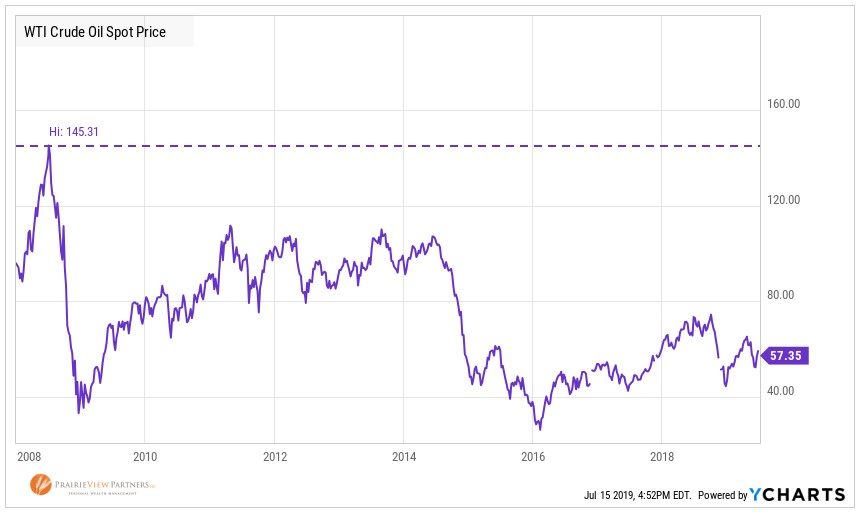
Regardless of why oil prices are high, they will likely be lower again – we just won’t know when or why they turn lower and our interpretation of why they are high or low shouldn’t influence our investment decisions. Anyone remember the notion that the price of oil would be “permanently higher” in 2008 when it was $145 per barrel? It’s $57 per barrel now.
Interest rates actually can go from low to lower
After a decade of historically low interest rates, nearly all of the prevailing interest rate predictions in recent years went something like this: “After interest rates have been so low for so long, they can only go up”. The Federal Reserve reinforced this notion as it continued its path of gradually increasing its benchmark rate throughout 2018. In January 2019, every single economist surveyed by the Wall Street Journal predicted that interest rates would be higher in June than they were in January with an average estimate of the 10-year Treasury reaching 2.96% in June.
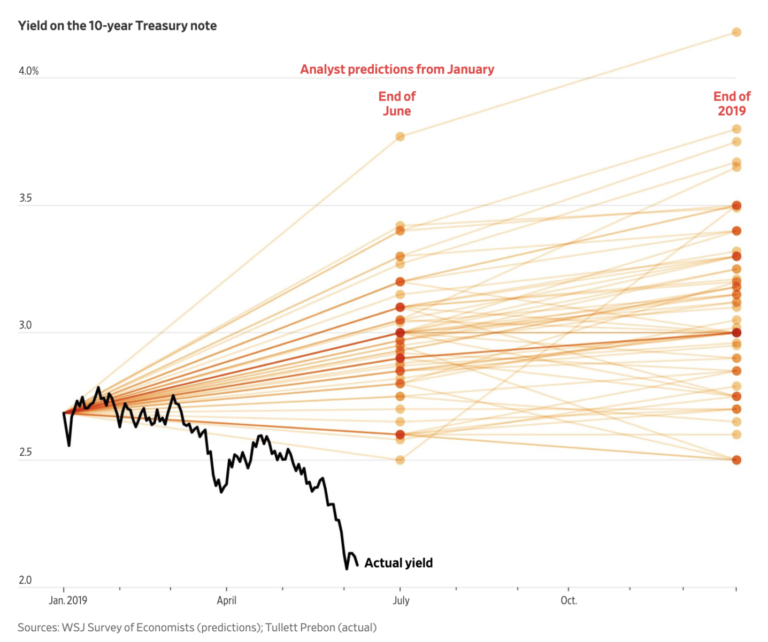
On June 20th, as the 10-year Treasury settled at 1.98%, the Wall Street Journal ran this headline: “10-Year Treasury Yield Falls Below 2%, Defying Expectations”. These are some of the most the most astute economists in the country! Surely, they should have been able to correctly interpret facts concerning something as foundational to economics as interest rates.
An investor who made an investment decision based upon those economists’ interpretation of the fact may have sold the very types of investments that benefitted from interest rates falling again. Here’s where this gets interesting. Those same investments performed poorly when interest rates were rising during 2018. This would have made it even easier to sell them based on those economists’ interpretations of interest rates.
Whether we’re wondering what’s next for stocks after their best opening half to a year since 1997, what high or low oil prices mean for the economy and financial asset prices, or what direction interest rates are going to move next our best protection against an uncertain future is diversification. Unfortunately, diversification also means always owning something that isn’t performing well, but as we’ve seen with interest rates this year you never know when you might benefit from owning an asset that recently under-performed.
Recent returns and long-term comparisons
Before we conclude, we want to provide our summary of recent returns and a couple interesting comparisons to some longer, more relevant time horizons.
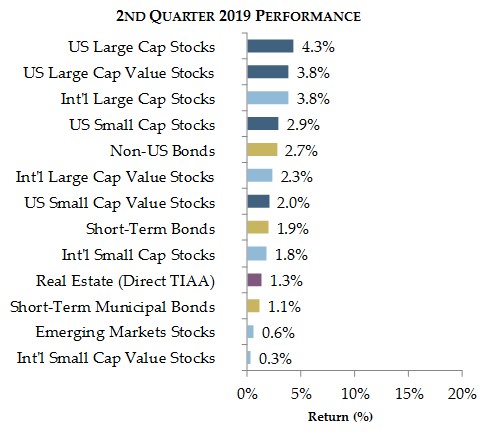
Continuing on their recent trend, US stocks as measured by the S&P 500 followed up their strong first quarter performance posting a 4.3% return for the second quarter. Combined with its first quarter return, the S&P 500 has returned 18.5% for the year through June 30th, and 26.5% from their 2018 low.
In the category of “things that no one saw coming”, it was very difficult to envision returns like this in the ensuing six months as stock prices reached their nadir in December. It should also be noted that these returns have happened despite economic, geopolitical and other risks remaining prevalent the daily news.
The image below shows that during the quarter all classes of stocks, bonds, and real estate posted positive returns, yet how they performed relative to one another looks quite random.
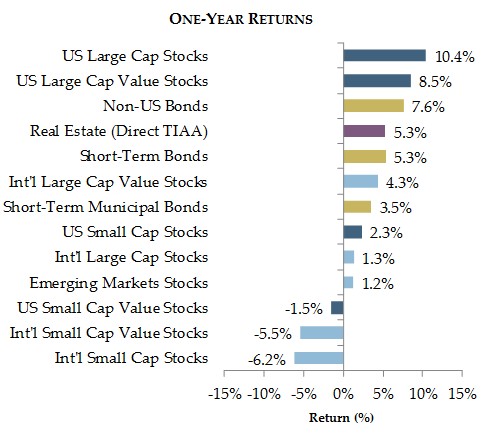
When we look at the image of returns over the last year, we still see both stocks and bonds near the top and actually see a few categories of stocks that have yet to recover from their 2018 declines.
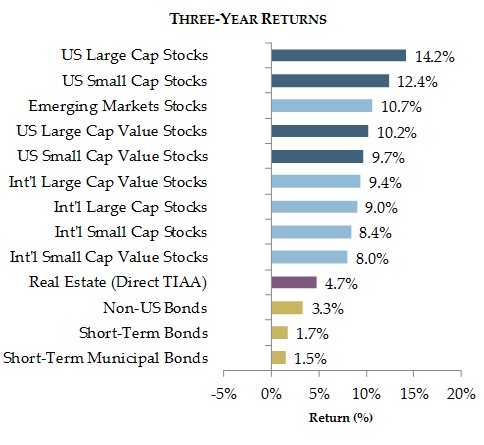
We don’t need to go back too much farther to see a trend start to emerge. The image below shows that in the last three years all stock categories have risen to the top.
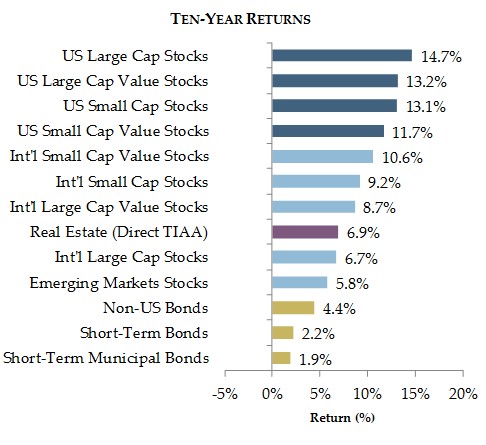
The last 10 years of returns are shown below to confirm this trend of stocks posting positive long-term returns despite short-term decline or returns below that of bonds.
The returns we experience over the next quarter or year are likely to look very different from any long-term trend or expectation. There will be many more facts that come with many varying interpretations from experts encouraging action based on one interpretation or the other. But, the only interpretations of facts that should impact our investment decisions is how your financial plan and your goals impact your portfolio.
Now go and enjoy the rest of 2019 – there is still a whole six months left!
Thank you again for allowing us to serve you and please let us know if you have any questions or comments. We always look forward to hearing from you.
Best wishes,
PrairieView Partners
Source: YCharts. Indices: S&P 500, Russell 1000 Value, CRSP US Small Cap, CRSP US Small Cap Value, MSCI World Ex USA, MSCI ACWI Value, MSCI ACWI Small Cap Value, MSCI Small Cap World Ex USA, MSCI Emerging Markets, Barclays US Government/Credit 1-5 Year, Barclays Global Agg Ex-US Hedged, Barclays Municipal Bond 1-5 Year, TIAA Real Estate Account. All index returns presented as total return inclusive of dividends.