


- July 8, 2025
After examining Amazon’s rocky past and recent meteoric rise, let’s take a look at a very different case study; the story of GE. For years, General Electric was the gold standard of blue chip stocks; strong earnings growth sent the stock price higher year after year, and the dividend increased annually like clockwork. Many considered the company a proxy for the entire U.S. economy. Until it wasn’t.
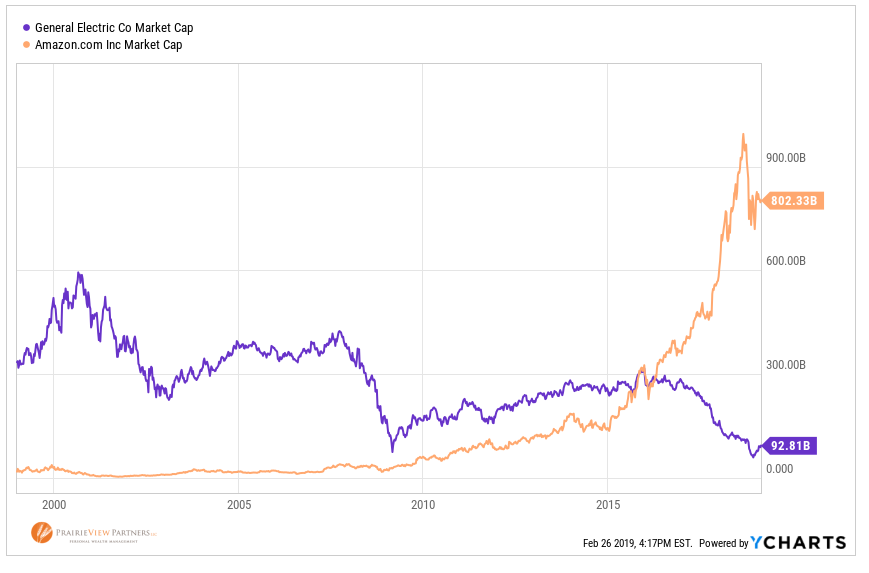
Ironically, the last time GE’s stock hit an all-time high, was shortly before Amazon’s nearly bottomed out in 2001. Eighteen years later, the company has lost a staggering $460 Billion in market value, roughly the current value of Facebook. The company used to dominate any industry it turned its attention to, much like Amazon today. Now, however, through the results of hubris, bad deal-making and risky investments, GE finds itself trying to scrape together enough cash to meet its debt obligations and its token 1-cent dividend.
Mismanagement Can’t Hide Forever
The sectors that GE competes in, like Avionics and Healthcare, have seen huge growth without major disruption, yet the company has still languished. Many savvy investors may have foreseen that the internet would disrupt slow moving companies with large overhead in entrenched sectors like retail (think Sears), but no one would have been able to predict a slew of bad managerial decisions from a company that for years was fertile recruiting ground for CEOs of other Fortune 500 companies.
GE’s story is a good example of the hot hand fallacy. The hot hand fallacy is a cognitive bias in statistics and probability. It gets its name from when basketball players are considered to be “on fire” after making a string of shots in a row, so the team tries to get the ball to the player with the hot hand so he/she can continue making shots. The trouble is, statistics show there is no truth or benefit to this strategy. Players that have made multiple shots in a row are no more likely to make the next shot, than they normally would be if they hadn’t made one the whole night.
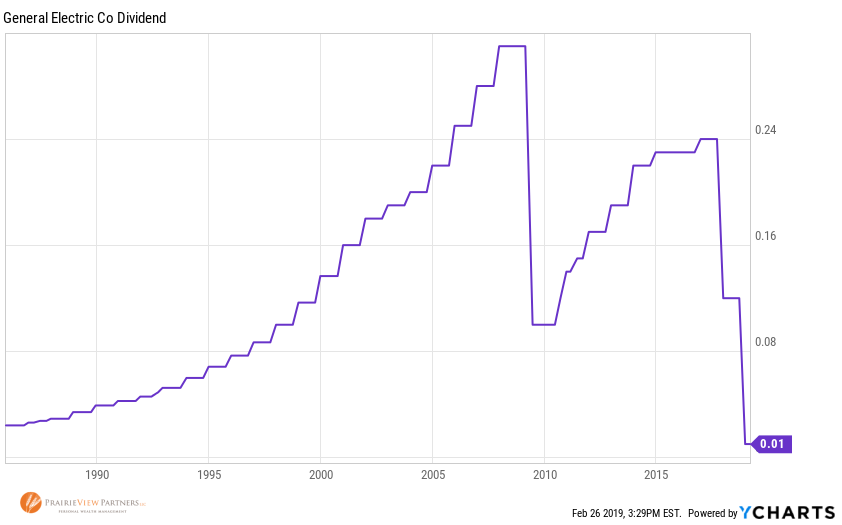
GE had the hot hand for 30 years. They couldn’t miss, their stock price seemed to only go up, and their dividend was rock solid, just take a look at the chart below. Many investors piled big percentages of their portfolios into the stock in hopes of continued success. But, like those annoying disclaimers on TV always say, past performance is not always an indicator of future results. While these disclaimers are mostly given for legal protection, sadly, they’re too often true – particularly for individual stocks. Past performance is just that, it’s in the past. It can’t be extrapolated forward.
Where does GE go From Here?
Today, we’re at a speculative crossroads. Will GE continue to falter, and become another cautionary tale of a company that got complacent and quit innovating? Or is this GE’s 93% drop like we talked about last time with Amazon, and they’re set to stage a massive rally? (GE is only down 82% from its all-time high, I don’t want to be accused of over-exaggerating) The truth is that we don’t know. That’s why CNBC never has us on their show.
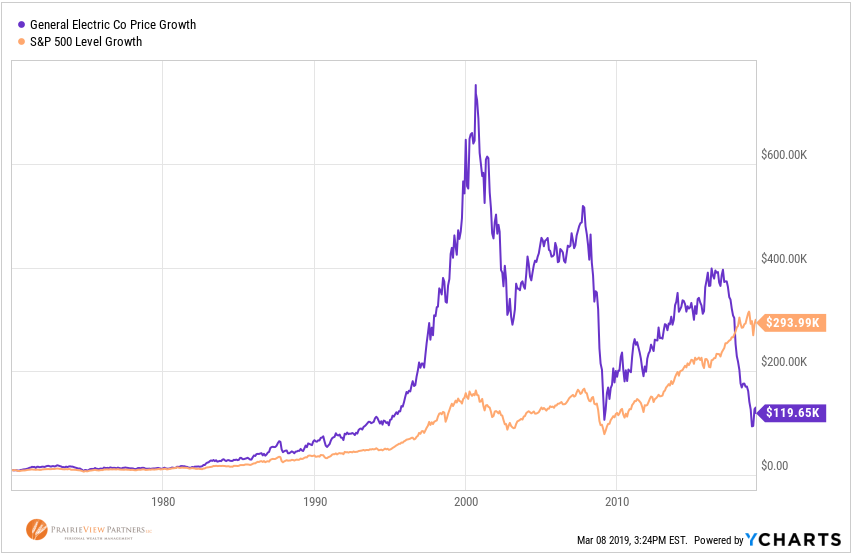
What we do know, is that we can avoid this speculative exercise through diversification. This next graph really couldn’t depict it any better. It shows the hypothetical investment of ten thousand dollars into GE and the S&P 500 on January 1, 1970. Note that if you held the diversified index via an ETF during this time, which includes GE’s three decades of growth and its 82% collapse, your investment is still worth more than 2X what GE is now, and nearly 30X your initial investment. Let’s give a quick shout-out to compounding.
On a sadder and more personal note, many GE employees who accumulated and held onto company stock throughout their career now have a fraction of what they expected for their retirement savings. As counterintuitive as it may seem, selling when the stock is going up can help keep the overall allocation of an investment in balance and diversify the risk of a downturn in an individual position. For many years, GE stock was considered recession proof; safer than investing in the broader market. But in an investment world with an uncertain future, diversification offers the best assurance of long-term investment success.
Source for all data: Ycharts