As the first decade of the 21st century came to a close, financial commentators across the news media were quick to coin what they felt was an apt description of the last 10 years for equity investors: The Lost Decade. After all, the S&P 500 provided investors with a cumulative LOSS of 9.1% from December 31, 1999 to December 31, 2009. Unfortunately, the financial media is doing the investing public a tremendous disservice by writing off the last decade so blithely. First, although the S&P 500 is an important index, it represents only one of numerous asset classes that a well-diversified portfolio should include. Investors with globally diversified portfolios actually experienced positive returns during the decade. Second, the focus on the negative returns from the last decade has also caused investors to become pessimistic about future stock market performance. Such a reaction is natural because as humans we tend to extrapolate recent events into the future. Keeping this behavior in check, however, is important because any investment strategy based on a “rear view mirror” approach usually leads to adverse results.
A Lost Decade Indeed
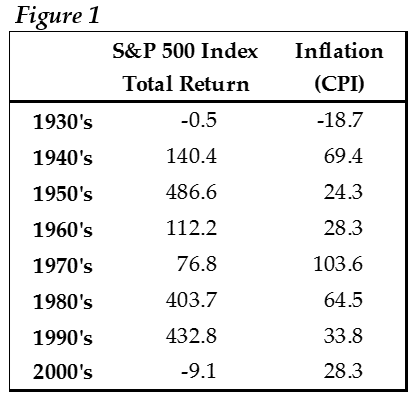
The last decade was the worst yet for U.S. stock investors, even after an astounding rebound during the last ten months of 2009, during which the S&P 500 Index surged over 55%. To be precise, the S&P 500 had a total return of negative 9.1% since the beginning of 2000. This was worse than even the returns of the depression era decade of the 1930s (see Figure 1).
An investment of $100,000 in the S&P 500 on the eve of Y2K was worth $90,934 at the end of 2009. Things look even worse when you consider inflation. Over the last ten years, the Consumer Price Index rose by more the 28%, which means something that cost $100,000 at the beginning of 2000 cost $128,330 by the end of 2009. So the loss in stocks AND the increase in inflation caused a combined loss of purchasing power of over 37%. A lost decade indeed.
Diversification Was the Key
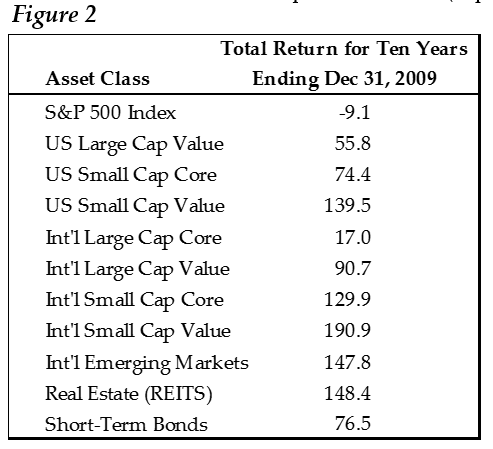
Despite the attention that’s been given to poor stock performance, (represented by the S&P 500), investors with globally diversified portfolios experienced positive returns during this same decade. What the most often cited “performance” numbers fail to acknowledge is that the S&P 500 represents only one of numerous asset classes from which investors can and should choose. Consider the total returns generated by a handful of other asset classes over the same “Lost Decade” (See Figure 2).
International Small Cap stocks were the top performer with a total return of over 190%, and four other asset classes earned over 100%. For those who adhered to a globally diversified investment strategy, the returns over the last decade weren’t all that bad. Furthermore, the data reinforces the idea that equity diversification doesn’t work all the time, but it works over time. Even though all of the asset classes in the table above experienced steep declines during the market crisis of 2008-2009, over longer, more meaningful time periods, exposure to these diverse asset classes should improve returns and ultimately reduce portfolio volatility.
Looking into the Rear View Mirror
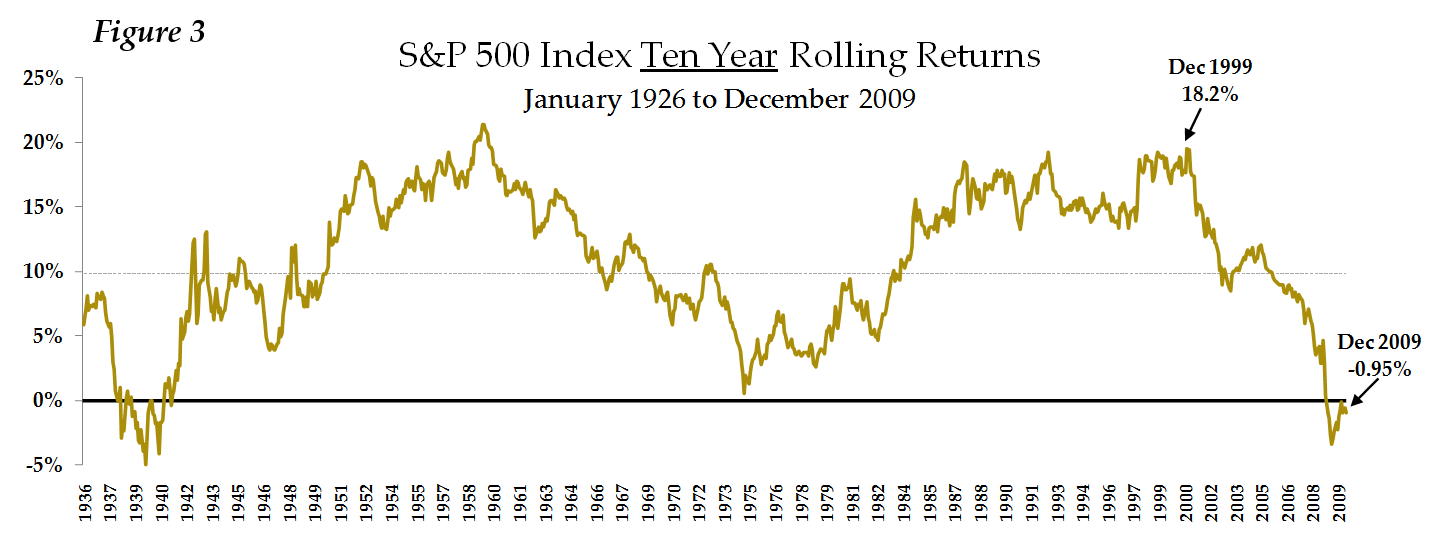
The poor performance of the last decade has also caused investors to become pessimistic about future stock market returns. This is a natural effect because as humans we tend to extrapolate recent events (or in this case the last ten years) into the future. Behavior scientists refer to this as the Recency Effect. It occurs when investors become overly pessimistic when things are going poorly and overly optimistic when things are going well. To further emphasize how the Recency Effect can affect investors, let’s look back ten years to the end of 1999 when the S&P 500 had an average annual return of 18.2% for the trailing ten years (See Figure 3).
Because of this incredible past investment return, investors were feeling very optimistic about future returns. A Paine Webber and Gallup Organization survey released in July 1999 showed that the least experienced investors, those who have invested for less than five years, were expecting annual returns over the next ten years of 22.6%. Even more experienced investors, those who have invested for more than 10 years, were still expecting annual returns of 16.2% – a severe case of investors looking into the rear view mirror and being overly optimistic about future stocks market returns. The actual annual return for the S&P 500 turned out to be -0.95%.
Gallup still conducts similar surveys, unfortunately, they no longer ask investors for their expectations of future annual returns for the next 10 years. If they did, my guess based on the belief that investors tend to focus on what has happened recently, which has been poor stock performance, the expected return would be a very low number.
Armed with this knowledge and an understanding of history, one would infer the prospects for the S&P 500 in the coming decade should look much better than the last, partly because this is such a low hurdle to beat. But we cannot know for sure what the next 10 years will bring. Staying diversified by maintaining balanced exposure to a broad spectrum of investments, will reduce the likelihood that your portfolio will be left behind like so many investors were over the last decade.