We have many reasons for our love of data. Data helps bring certainty to an uncertain world. Data can quantify an expected outcome when carrying out a plan. Data help put events into perspective and tell a story. Data can even help mask our true feelings.
Yes, you read that right. Data can cause us to ignore our feelings or sweep them under the proverbial rug. You may now be thinking, “Wait, we’re not supposed to avoid our true feelings!” That’s right – it’s not a good idea to ignore or cover up what we feel by burying our heads in data.
This is too often the problem with data, though, in the world of investments. It doesn’t capture the feelings we have when we watch markets experience declines or fluctuate wildly day after day. Sure, data can mask those feelings or provide temporary reprieve but it doesn’t always make us feel better when experiencing declines.
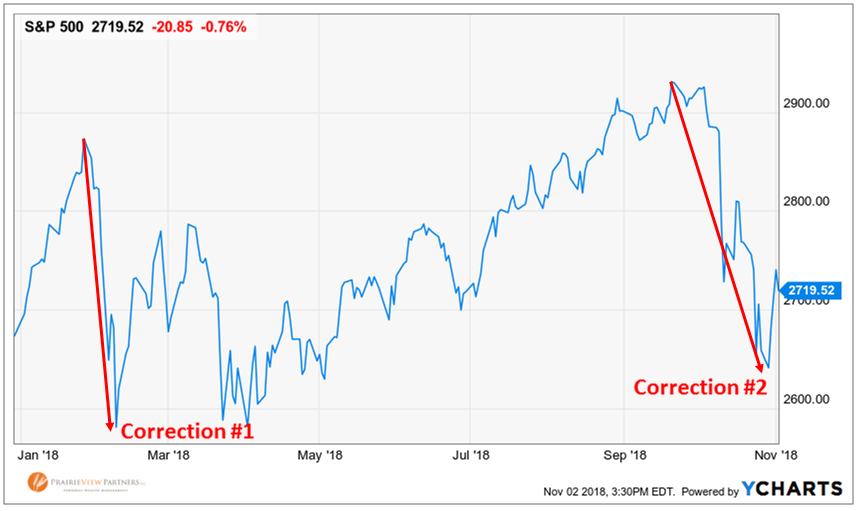
The data told us during the trading day on Monday, October 29th that the S&P 500 had officially experienced its second “correction” of the year after declining 10.1% from its September peak. By the end of the trading day, the index was only down 9.8% from its September peak and was no longer in correction territory. Phew! Thankfully, the data told us the coast is clear and all is right in the world! I’m sure that 0.3% difference made us all feel so much better about stock prices!
We can use data to show you that market corrections of 10% have happened about once a year on average throughout history. Yes, there have been two now in 2018, but there were zero in 2017, so we’re still average. We can say that the average intra-year decline in share prices is 14%, so a decline of “only” 10% is less than normal. We can also say that the majority of 10% declines have not precipitated bear markets (a 20% decline). This data may help provide perspective, but might not make the next decline any less worrisome in the moment.
In the moment of a price decline, the real concern might not be “when is it going to stop?” but rather, “am I going to be ok?” This distinction is important. The data can provide a probability of when prices might turn back up, but no one can know when that might happen with certainty – only that stock prices will eventually go back up.
Only planning can answer the question to your real concern, “Will I still be able to accomplish my goals?” Only planning that incorporates all the data and probabilities of various outcomes can help give you the answer, “Yes, you’re going to be ok.”
The most valuable use of data, especially during a scary market decline, is its ability to provide a foundation for objectivity when objectivity is needed most. Data helps us look past our feelings of immediate concern and bring perspective to see the long-term. Because the goal is not to ignore those feelings of concern during market declines. The goal is to avoid acting on them.
Source: All data provided by YCharts.