


- April 16, 2024
Depending on the day lately, you might see a study or expert cite one of two points. Either inflation is a thing of the past, or all this “money printing” is setting us up for higher inflation in the future. Both sides seem to make compelling arguments. Unfortunately, like so many things, it’s not as simple as pointing to one data point or the other.
Yes, the money supply has increased tremendously going back to the Great Financial Crisis and accelerated in recent months. But, this doesn’t tell the whole story about the potential for inflation.
Yes, economic activity is low, which is rarely a foundation for inflation. But, it will recover and begin growing again.
Let’s see if we can get to the bottom of this
**Before continuing, I’ll add my “slightly more wonky than usual” disclaimer that I’ll do my best to keep a topic like inflation entertaining. Here we go…**
Economics is referred to as the “Dismal Science” because experiments can’t be carried out in a controlled environment and outcomes of experiments aren’t known for many years. Some aspects of the discipline bear more resemblance to the humanities than physics.
Despite mountains of economic data and equations, human expectations, biases, and choices play a central role in economic outcomes. Inflation is perhaps the area of economics where these human factors are most influential.
Is inflation good or bad?
Inflation generally carries a negative connotation because most of us associate inflation with the high inflation of the late 1970s and early 1980s. That level of inflation is most certainly bad and leads to the expectation of higher prices. This in turn leads to behavior that drives prices higher still. You can see how this might feed on itself.
The opposite of inflation, deflation, is similarly as bad as high inflation. The expectation of falling prices causes consumers and businesses to delay purchases and investments in anticipation of lower prices, thus curtailing economic activity. Deflation is viewed as the harder problem to solve than high inflation. This partly explains why central banks are so quick to cut rates in economic weakness but are very patient, or “measured” in central bank-speak, when beginning to raise rates.
But, a modest and steady level of inflation is a key ingredient in a healthy and growing economy. It provides the right amount of incentive for consumers and businesses to spend and invest and fuel economic growth. This is why we often hear the Federal Reserve speak of a target inflation rate of approximately 2%.
For most of the last 30 years, and even more so in the last 10, we have experienced historically benign levels of inflation. This was the case despite persistently low interest rates and other expansionary policies generally thought to create run-away inflation.
Here’s a summary of annual rates of inflation during some recent time periods.
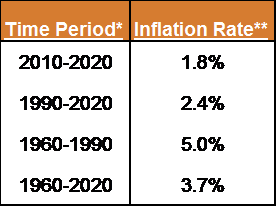
**Headline or total CPI for all consumers; annual rate of change.
What does it measure?
“Inflation” is a general measurement of the price increase of goods and services in an economy. Let’s start to pick this apart. A general measurement is intended to capture prices across the entire economy. However, at different times in our lives we might be more affected by different components of inflation. And different components experience very different rates of change.
The chart below shows a 346% gap between the price increase in Education and in Information Technology. Your iPhone is a lot cheaper while you’re paying a lot more for tuition over the last 27 years.
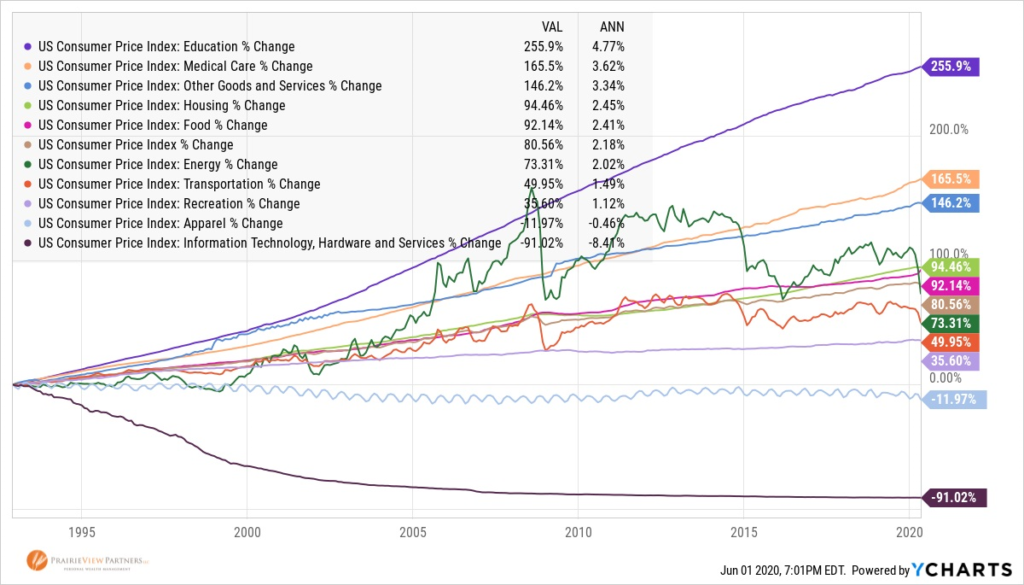
The above chart often leads people to conclude that we have seen high inflation in things we need, but low inflation in things we want. A more apt conclusion might be that components with more competition have seen less inflation while those with less competition have seen higher inflation.
It’s easier for us to go between Amazon.com and Target.com to find cheaper prices on things we want these days than the more limited choice of decades ago. For better or for worse, there remains to be few viable alternatives to a four-year degree, which leads to inflationary pressures on tuition.
Regardless of the cause, the fact that we can break that apart allows us to plan for those differences. You’ll see us apply different rates of inflation for future Education and Healthcare goals while maintaining a more modest assumption for general spending.
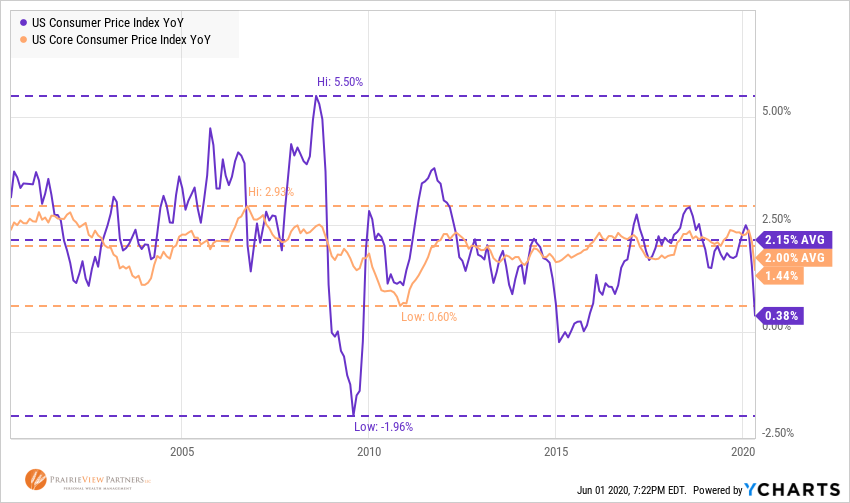
Inflation minus food and energy
Have you ever heard inflation referred to as “Core” inflation, that excludes energy and food, and thought, “I spend a lot of money on energy and food, why don’t they count those”? In setting their goal of 2% inflation, the Federal Reserve targets “Core” inflation, which excludes food and energy.
This has nothing to do with them not being important components of households’ budgets. It’s all about benchmarking policy to an appropriate target. Food and energy are highly volatile compared to other components and their movements tend to also be incorporated into other components over time.
The chart below highlights the volatility difference in Core versus Normal Consumer Price Index (CPI). Over a longer period of time, the two measures end up very close, but setting interest rate policy based on a more volatile measure can be exceedingly difficult. Think of it this way: would you rather chase a Jack Russell Terrier or a slightly aged Goldendoodle around your backyard?
The future of inflation
As is usually the case, this is a prediction and forecast-free zone. But there are some economic fundamentals that can inform us of what the inflationary environment in the future might look like. And, to what degree we should be concerned about all the “money printing”.
Competition
As I alluded to earlier, the pervasiveness of choice and transparency across most consumer categories signals lower inflation as opposed to higher. Choice and transparency apply to both product and source. Have you seen all the options for mattresses ordered online and shipped directly to your home? You can still buy mattresses in a store, too.
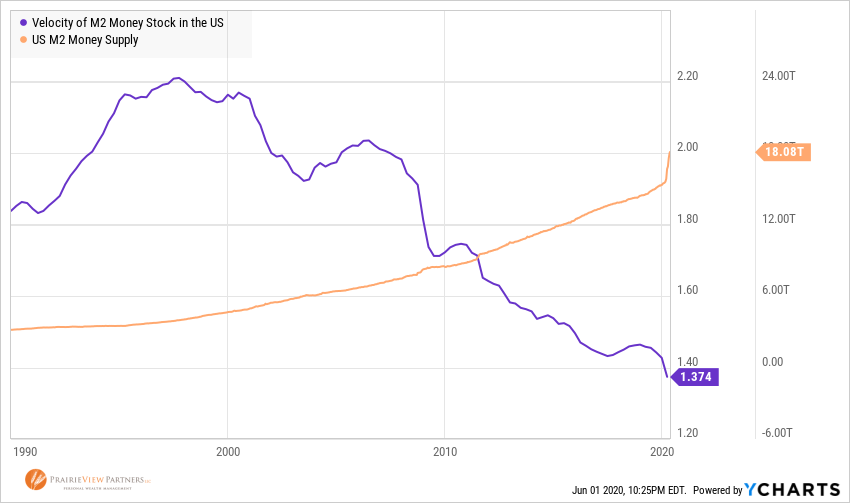
Money Supply, or “Money Printing”
One might be concerned that if there is an increasing amount of money in the economy chasing those direct-ship mattresses, that the prices of those mattresses will rise. This is not necessarily true. The impact of the growth of the supply of money, or how much money is “printed”, accounts for half of the inflation equation.
The other half is how often that money changes hands, or the “velocity” at which the money flows through the economy. If more money is added to the system and it continues to flow through the system at the same pace, inflation will most certainly follow. If money is added to the system, but flows through it at a slower pace, inflation will offset this. This is exactly what we have seen for the last 25 years when “Money Supply” and “Money Velocity” have been almost perfectly negatively correlated.
The chart below shows money velocity beginning to fall in the late ‘90s and falling sharply after the Great Financial Crisis. Much of the money added to the system in response to that crisis never made it off bank balance sheets as bank capital requirements increased and lending became stricter.
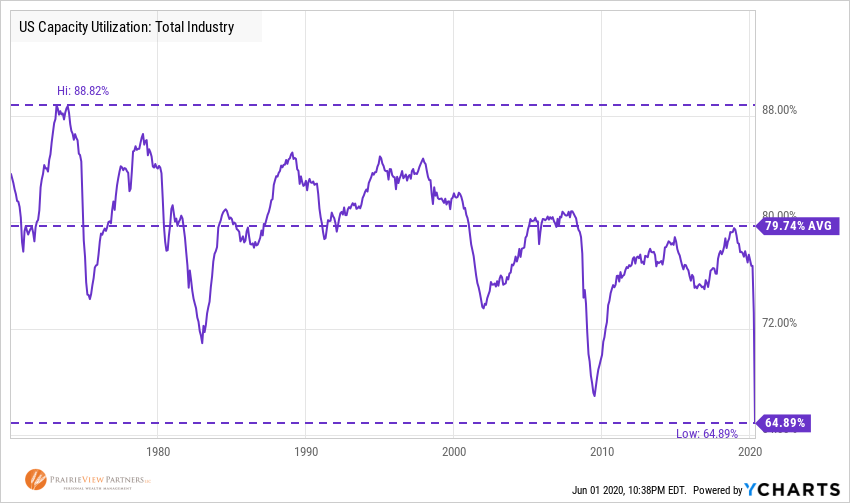
Economic Capacity Utilization
Like our refrigerators have a capacity for food and beverage – maybe that’s been tested more with recent stocking-up habits – our economy has a capacity to produce goods and services. If your family grows to the point were more food is needed on hand, maybe you buy a new, more expensive refrigerator. Historically, if the economy grew to a certain point, more capacity was needed to facilitate growth. This meant more factories, trucks and trains, or other physical capacity.
Each economic recovery from recessions going back to the 1980’s has seen capacity usage remain below its pre-recession high. This is because of innovation – businesses learn how to do more with less when times get tough and don’t need to use as much capacity to create more output.
Further, as our economy has shifted away from manufacturing, continued growth becomes less capacity constrained. It’s more efficient to write additional computer code to expand Airbnb’s capacity than for Hilton to build a new hotel. Even those online-ordered, direct-delivery mattresses need less capacity without showrooms and tighter inventory management afforded them by online ordering. These trends all support lower inflation.
Expectations
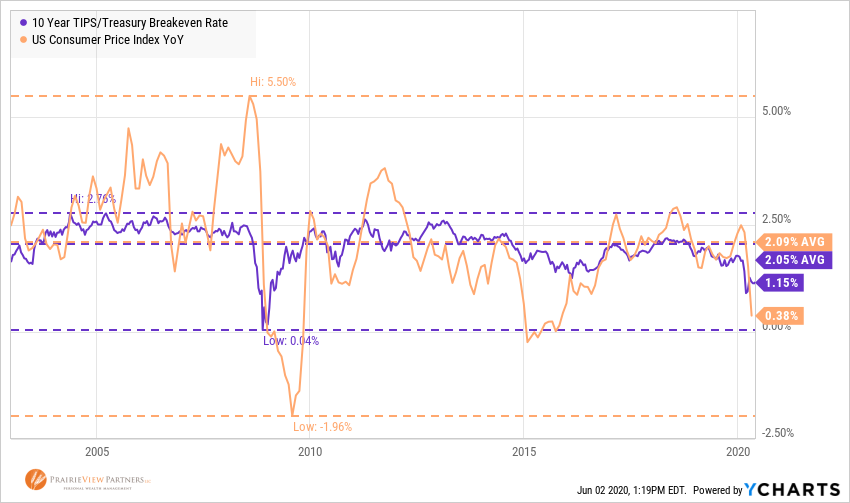
If economic data are the building blocks of inflation, expectations provide the glue that helps them take shape. And markets can help us gauge expectations. As we are apt to say about stock and bond prices, markets process all of the available information to set prices accordingly. Thanks to the US Treasury, we also have the ability to evaluate inflation expectations this way.
The US Treasury issues bonds that are “nominal” that pay a fixed interest rate. They also issue bonds that pay interest rates indexed to inflation, referred to as Treasury Inflation Protected Securities, or TIPS. TIPS prices in the market are based on the culmination of the market’s assessment of how economic data are likely to influence inflation.
The spread, or differential, in rates on the two bonds, is a market-based indication of inflation expectations for the next 10 years. At the time of this writing, that spread is 1.15%. This indicates modest to low inflation over the next 10 years. The chart below indicates that since 2003 (the length of time this spread has been measured) the averages of expected inflation and actual inflation have been very close with actual exhibiting more volatility.
Expected doesn’t equal assured
Like stock returns over short periods, actual inflation may be very different in shorter periods than the long-term expectation. And the long-term expectation may be different than the expectation. But, as our economy has evolved over time, there are factors that support generally lower inflation in the future than in the past. They also make it less susceptible to unexpected spikes like we saw in the 1970s and 1980s. Market-based forces that allow for greater transparency into collective inflation expectations also support fewer inflationary “shocks” to the economy.
The ability to break inflation into individual components allows us to better match differing inflation expectations to your different goals. This can give more confidence that we are applying an appropriate expectation to the goal. This in turn helps inform how we invest for various goals, time frames, and sources of funds for those goals.
Stay tuned for Part 2 where I’ll dive into more specifics on the effect of inflation on investments and portfolios.
All data sourced from YCharts.